chapter 7. 히스토그램 이해
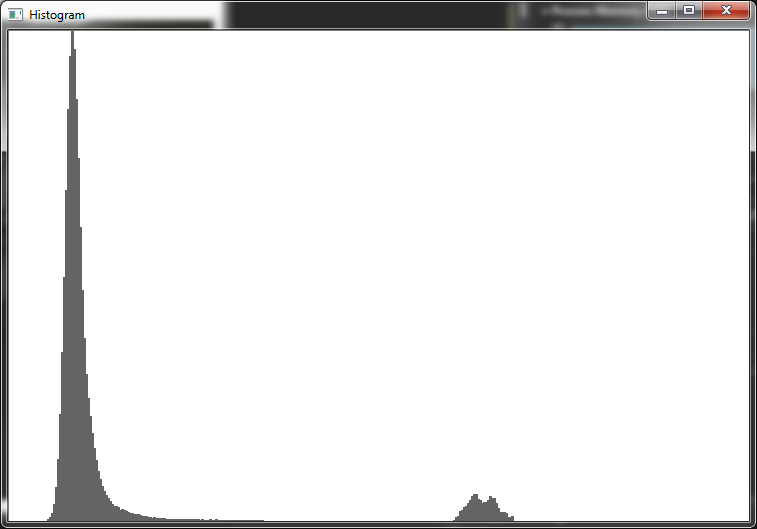
히스토그램은 가로로 이미지의 픽셀값을, 세로로 이미지의 픽셀 수를 나타낸 그래프입니다. 다르게 설명 하면, 좌측에서 부터 어두운영역이고 우측으로 갈 수록 밝은 영역입니다.
그래프 값은 어떤 영역에 값이 많은지 분포도를 보여주므로 좌측으로 많으면 어두운 이미지이고 우측으로 많으면 과다 노출 밝은 이미지 인 것입니다.
통상적으로 좌측은 그림자 영역이고, 중앙은 미드톤 영역, 우측은 밝은 영역으로 구분합니다.
아래 그림을 참조 하십시요.

Histogram 구하기
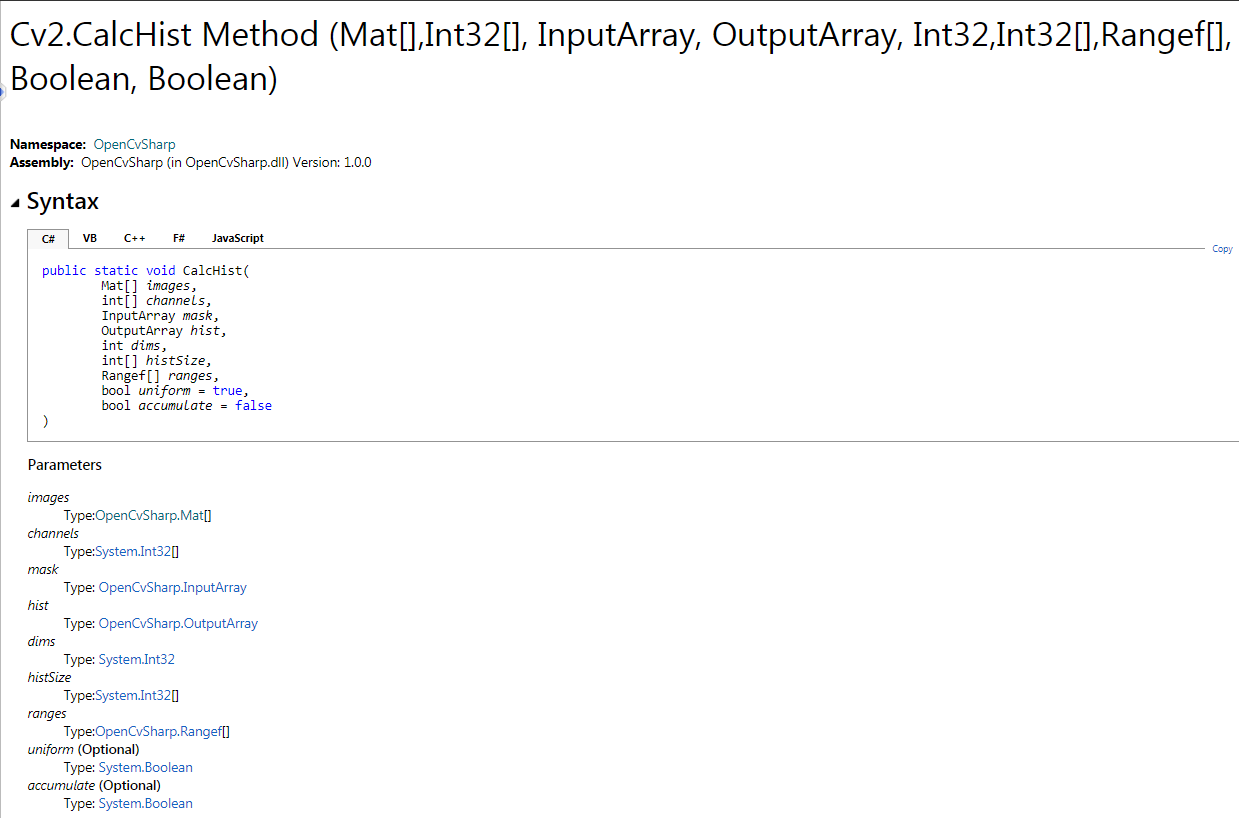
Opencv에서 Histogram 구하는 방식은 CalcHist() 함수를 사용합니다. 함수 내용은 아래와 같습니다.

CalcHist() 함수로 값을 구하고… 그래프를 그리면 됩니다. OpenCvSharp의 예제 프로그램 소스를 참조하십시요.
ImgLoad();
Mat src = frame.Clone();

//grayscale
Mat gray = src.CvtColor(ColorConversionCodes.BGR2GRAY);

// Histogram view
const int Width = 260, Height = 200;
Mat render = new Mat(new Size(Width, Height), MatType.CV_8UC3, Scalar.All(255));

// Calculate histogram
Mat hist = new Mat();
int[] hdims = { 256 }; // Histogram size for each dimension
Rangef[] ranges = { new Rangef(0, 256), }; // min/max
Cv2.CalcHist(
    new Mat[] { gray }, //Mat image
    new int[] { 0 },    //channels : grayscale = 0 / R,G,B = 0,1,2
    null,               //mask : all area = null
    hist,               //output
    1,                  //dims
    hdims,              //hist size
    ranges);            //range

// Get the max value of histogram
double minVal, maxVal;
Cv2.MinMaxLoc(hist, out minVal, out maxVal);

Scalar color = Scalar.All(100);

// Scales and draws histogram
hist = hist * (maxVal != 0 ? Height / maxVal : 0.0);
for (int j = 0; j < hdims[0]; ++j)
{
    int binW = (int)((double)Width / hdims[0]);
    render.Rectangle(
        new Point(j * binW, render.Rows - (int)hist.Get<float>(j)),
        new Point((j + 1) * binW, render.Rows),
        color,
        -1);
}

using (new Window("Image", WindowMode.AutoSize | WindowMode.FreeRatio, gray))
using (new Window("Histogram", WindowMode.AutoSize | WindowMode.FreeRatio, render))
{
    Cv2.WaitKey();
    Cv2.DestroyAllWindows();
}
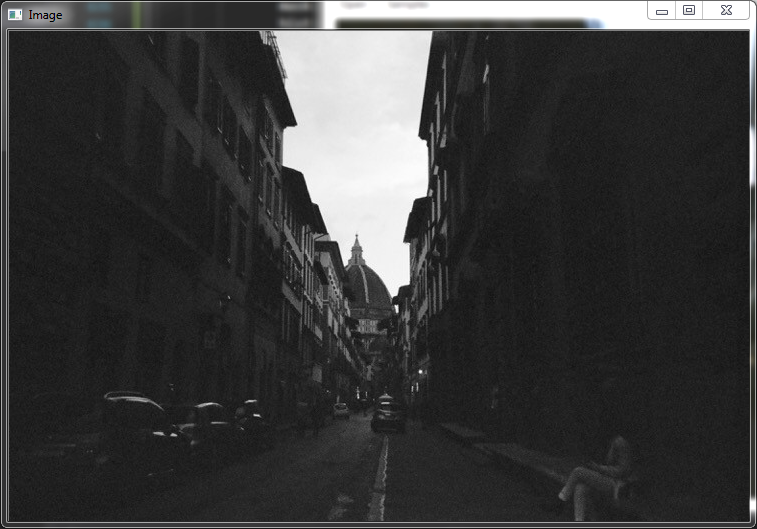
결과화면


다음엔 Histogram Equalization(히스토그램 평준화)에 대해서 알아보겠습니다.
Leave a comment